Every now and then users experience that the Sitecore client responds in a "slowly manner" at least for some actions. As you might know, the path from slow experience to unhappy customer is not long. Now what appears fast or normal to one user may appear slow to another user. Therefore it is beneficial for all parties if one can quantify what exactly the customer sees as slow. In the following article I will show how this can be done using an IE plugin called HttpWatch. There are other tools like Fiddler that does the same job.
Getting the plugin
The plugin can be found at http://www.httpwatch.com/. After installing it, the plugin will appear as a button in your IE toolbar.
Documenting Client Performance
Faced with a statement like "the client performs slowly" is too vague a statement to be of any value in either support or product management. Therefore such statements should be met by the following questions:
- What actions in the client do you see as slow?
- How long time do these actions take to perform?
- Do they always take this long?
Assuming you have identified an action that is seen as slow th efollowing guideline can be used to answer question 2. above on how long time this action actually takes.
- Navigate to the context in the client where the action is performed
- Open the HttpWatch plugin.
- Configure the plugin filter to show only content of type text/html - Close the HtppWatch Filter window.
- Choose "Start" in the plugin to monitor http traffic.
- Activate the action seen as slow - Wait until the client is updated.
- Choose "Stop"
Your HttpWatch window should now hold all the information needed to document the performance of this particular action. Below I have inserted a screendump showing the time it took to open the Content Editor on one of our 5.1.1 demo sites.
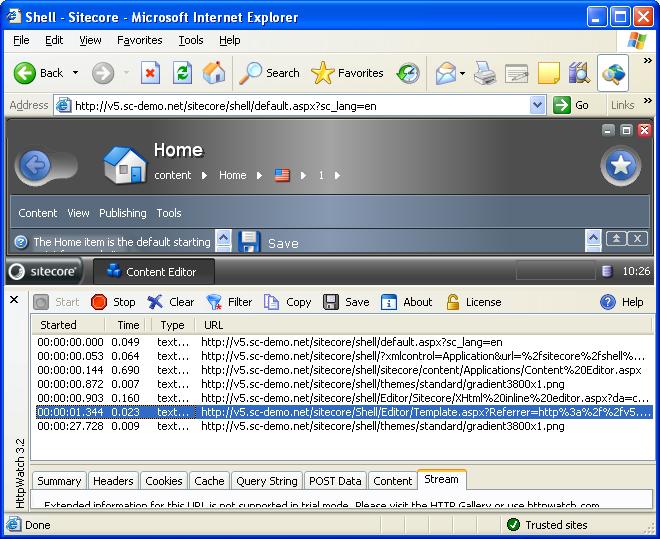
As can be seen above opening the Content Editor from the Start button leads to several http requests to the server, the last of them highlighted (the very last entry should be ignore). For each entry you can see when it was Started in seconds and milliseconds relative to the first http request. You can also see how long Time the request took. To calculate the total time it took from the first http request was sent to the last was received you simply calculate Started + Time for the entry giving the highest sum. Its usually the last one but not always as some requests run in parallel. In the above example the calculation is 1.344 + 0.023 = 1 second and 367 ms. Now by grabbing a screendump of this action it has been documented that for this particular activation it took app. 1.4 seconds to open the Content Editor for this user.
Important Analysis of the results
You should notice that the above results include the roundtrip time over your physical network, passing through firewalls, reverse proxies and limited by the speed of light. You name it. It is therefore important to keep an eye on how much of the time network traffic etc. accounts for.
The performance of some actions depend heavily on how much of the data has been cached. Therefore if you are the first one to enter the client after the server was booted you would experience much slower response times than on following requests. You should therefore make at least 2-3 samples when documenting the performance of a particular action in order to see how the client performs when data has been cached.
All the above allows you to rather than having a discussion on whether or not the client is too slow, you can e.g. have the more exact discussion on whether 1.4 second is acceptable for opening the Content Editor or not .